Every call and flow, traced
See each call your code makes, follow one request across services, and look at how your resources are wired. All in the console, as it happens.
The problem
One call often sets off many more. A file lands in S3, S3 tells a queue, a function reads the queue and writes to a database. pogi follows that chain for you, so you don't have to piece it together from separate logs.
How it works
01
Every call, live
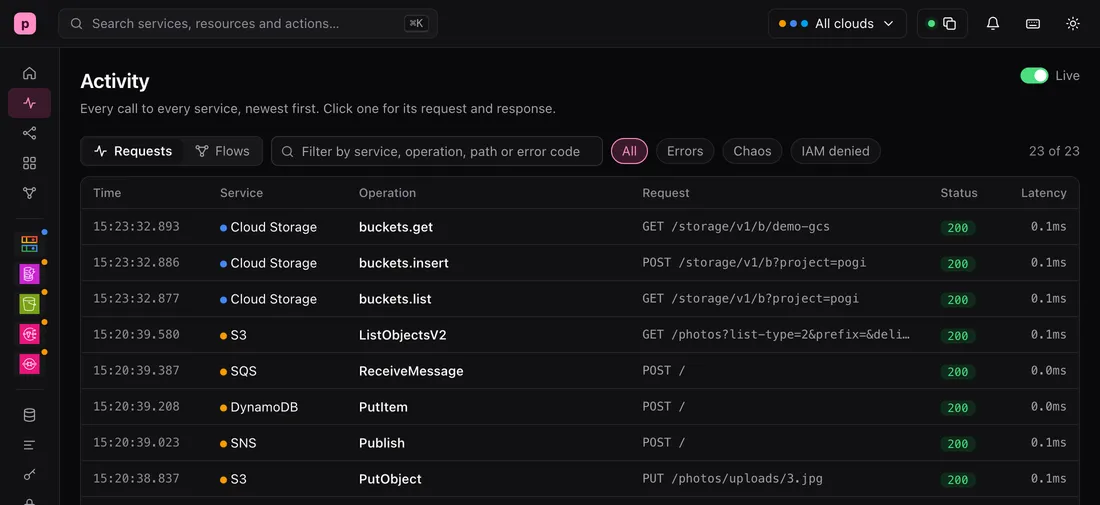
The Activity page lists every call to every service, newest first. Click a call to see its request and response. Filter to errors, calls that chaos changed, or calls that IAM refused.
localhost:7644/_pogi/localhost:7644/_pogi/Activity
Calls to all services, newest first.
TimeServiceOperationStatus- 15:20:39.580S3 ListObjectsV2ListObjectsV2200
- 15:20:39.387SQS ReceiveMessageReceiveMessage200
- 15:20:39.208DynamoDB PutItemPutItem200
- 15:20:39.023SNS PublishPublish200
- 15:20:38.837S3 PutObjectPutObject200
- 15:20:38.644SQS ReceiveMessageReceiveMessage200
02
Every flow, traced
Each request gets a trace ID, and pogi copies it into the messages it delivers. A chain such as S3 to SQS keeps one ID, so the Flows view shows it as one row. Open it to see a timeline, and click a step for its request and response.
localhost:7644/_pogi/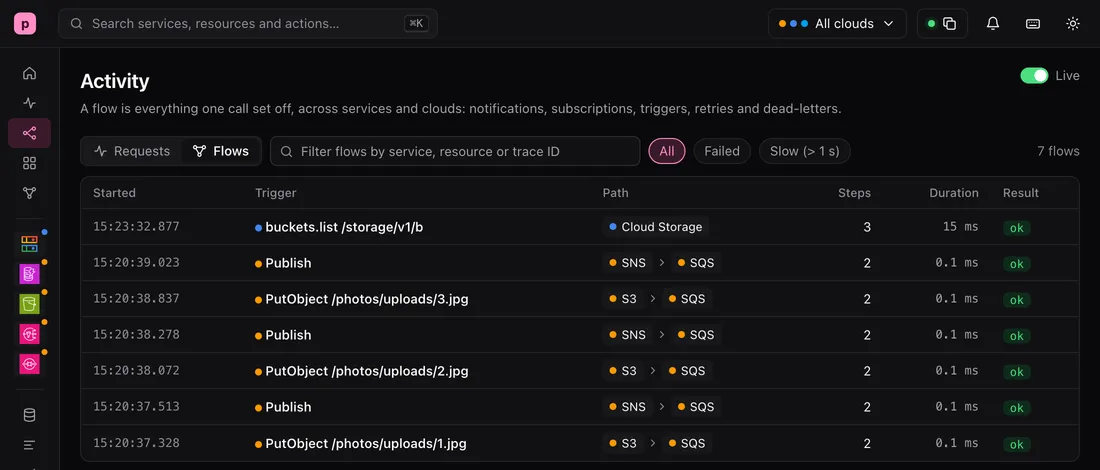 localhost:7644/_pogi/
Flows 1-b59c678e-d5c9f3488939b1fd1ef08ae2
PutObject /photos/uploads/1.jpg
2026-10-27 15:20:37 · 2 steps · 0.1 ms
- S3 PutObject0.1 ms
- SQS deliver → thumbnails0.0 ms
03
How it's wired
The Map draws your resources as boxes, grouped by cloud. A solid line is a link a service reports from its own settings. A dotted line was seen at runtime, and a dashed red line is a dead-letter queue. Export it as SVG.
localhost:7644/_pogi/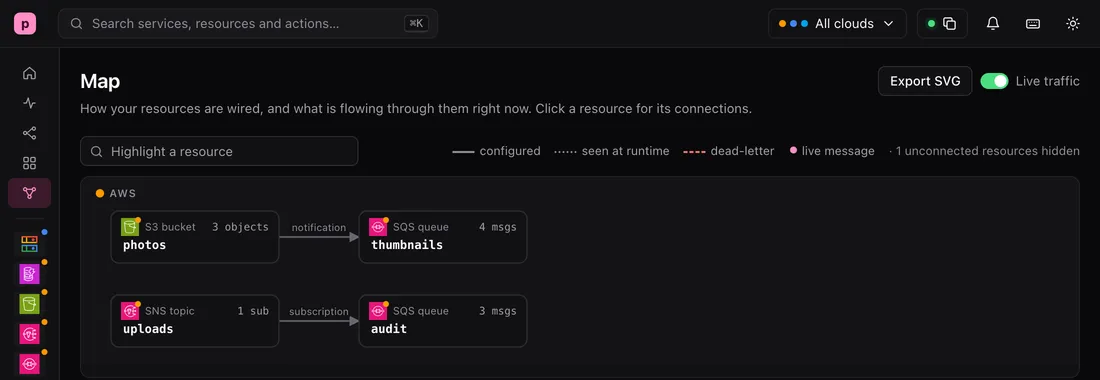 localhost:7644/_pogi/
Map. On AWS, the S3 bucket photos sends a notification to the SQS queue thumbnails. The SNS topic uploads feeds the SQS queue audit through a subscription.
Try it
This is real output from a running pogi.
Send three calls with one trace ID
TP=00-4bf92f3577b34da6a3ce929d0e0e4736-00f067aa0ba902b7-01
curl -H "traceparent: $TP" "http://localhost:7644/storage/v1/b?project=pogi"
curl -H "traceparent: $TP" -X POST -H "content-type: application/json" \
  -d '{"name":"demo-gcs"}' "http://localhost:7644/storage/v1/b?project=pogi"
curl -H "traceparent: $TP" "http://localhost:7644/storage/v1/b/demo-gcs"
Read the trace ID back
curl "http://localhost:7644/_pogi/api/requests?q=buckets.insert"

[{"id":22,"time":"2026-10-27T15:23:32.886148+05:30","cloud":"gcp","service":"gcs",
  "op":"buckets.insert","method":"POST","path":"/storage/v1/b?project=pogi",
  "status":200,"ms":0.126,"account":"000000000000","region":"us-east-1",
  "requestId":"ca243568899f770c07bcf8eae7b0d375",
  "principal":"arn:aws:iam::000000000000:root",
  "trace":"1-4bf92f35-77b34da6a3ce929d0e0e4736"}]
What to know
- A flow needs at least two steps. A single call with nothing after it is a plain request.
- Two requests that share a trace ID do not draw a line between their resources on the Map.
- The Map draws only links that a service reports or that pogi saw as a delivery. pogi does not guess links between clouds.
- Resources with no connection are hidden, and the Map says how many.
Learn it step by step
The guides are in the docs.